Community Veterans Engagement Board Project
Visualizing the Future Through Data

The concept of the Data Triangle started with the CVEBs project. From the report: "...success is a matter of looking at metrics arising from local needs and comparing them to local history while simultaneously listening to veterans themselves. Through consistency of examination and open-mindedness to local input, VEO can aggregate the numbers and stories, find common denominators and patterns, identify leverage points, and provide an across-the-enterprise picture that will richly contribute to the overall strategic mission of VA."
Project Duration: 6 months
Project Type: Federal
Agency Partner: Department of Veterans Affairs (VA)
Role: Lead
Stakeholders: Veterans Experience Office, Veterans Health Administration, Veterans Benefits Administration, National Cemetery Administration
Design Phases: Research
Skills: Design Strategy, Research, Writing, Data Visualization
Product Design Output: Next Generation Community Veterans Engagement Boards Report
Background
The Community Veterans Engagement Boards (CVEBs)1 were started by the Veterans Experience Office as a way to knit together the frequently fragmented community and VA service offerings available to veterans. The original CVEB developed organically in San Diego, where the leaders of the three VA Administrations and veteran service organizations sought to limit turf wars and undesirable service competition through actively collaborating with each other to support veterans. The network of useful redundancies2 they created have resulted in one of the healthiest and most support veteran communities in the country. Referencing the San Diego model, VEO brought CVEBs to communities across the country in just two years. In 2017, VEO asked the design team to study the now-extant CVEBs to find out what might be their desired futures, how to support them, and how to continue to grow robust communities.
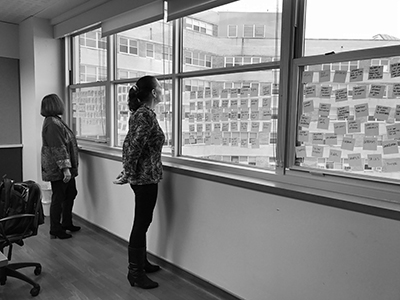
We conducted a series of workshops in five communities across the country, using a variety of methods to parse how they perceived themselves, surface their service gaps, and support them in envisioning their next steps. The resulting report contained a profile of diverse communities, common points, and direction on how VA might use these burgeoning communities to pilot new collaborative programs and spread best practices.
Below, find some data visualizations from the report. This project challenged me to codify how designers might visualize qualitative data into charts, what it means to make visual as well as text-based logical arguments, and how to both accurately and acutely show a qualitative process in the language of quantitative data, without misrepresenting that data.
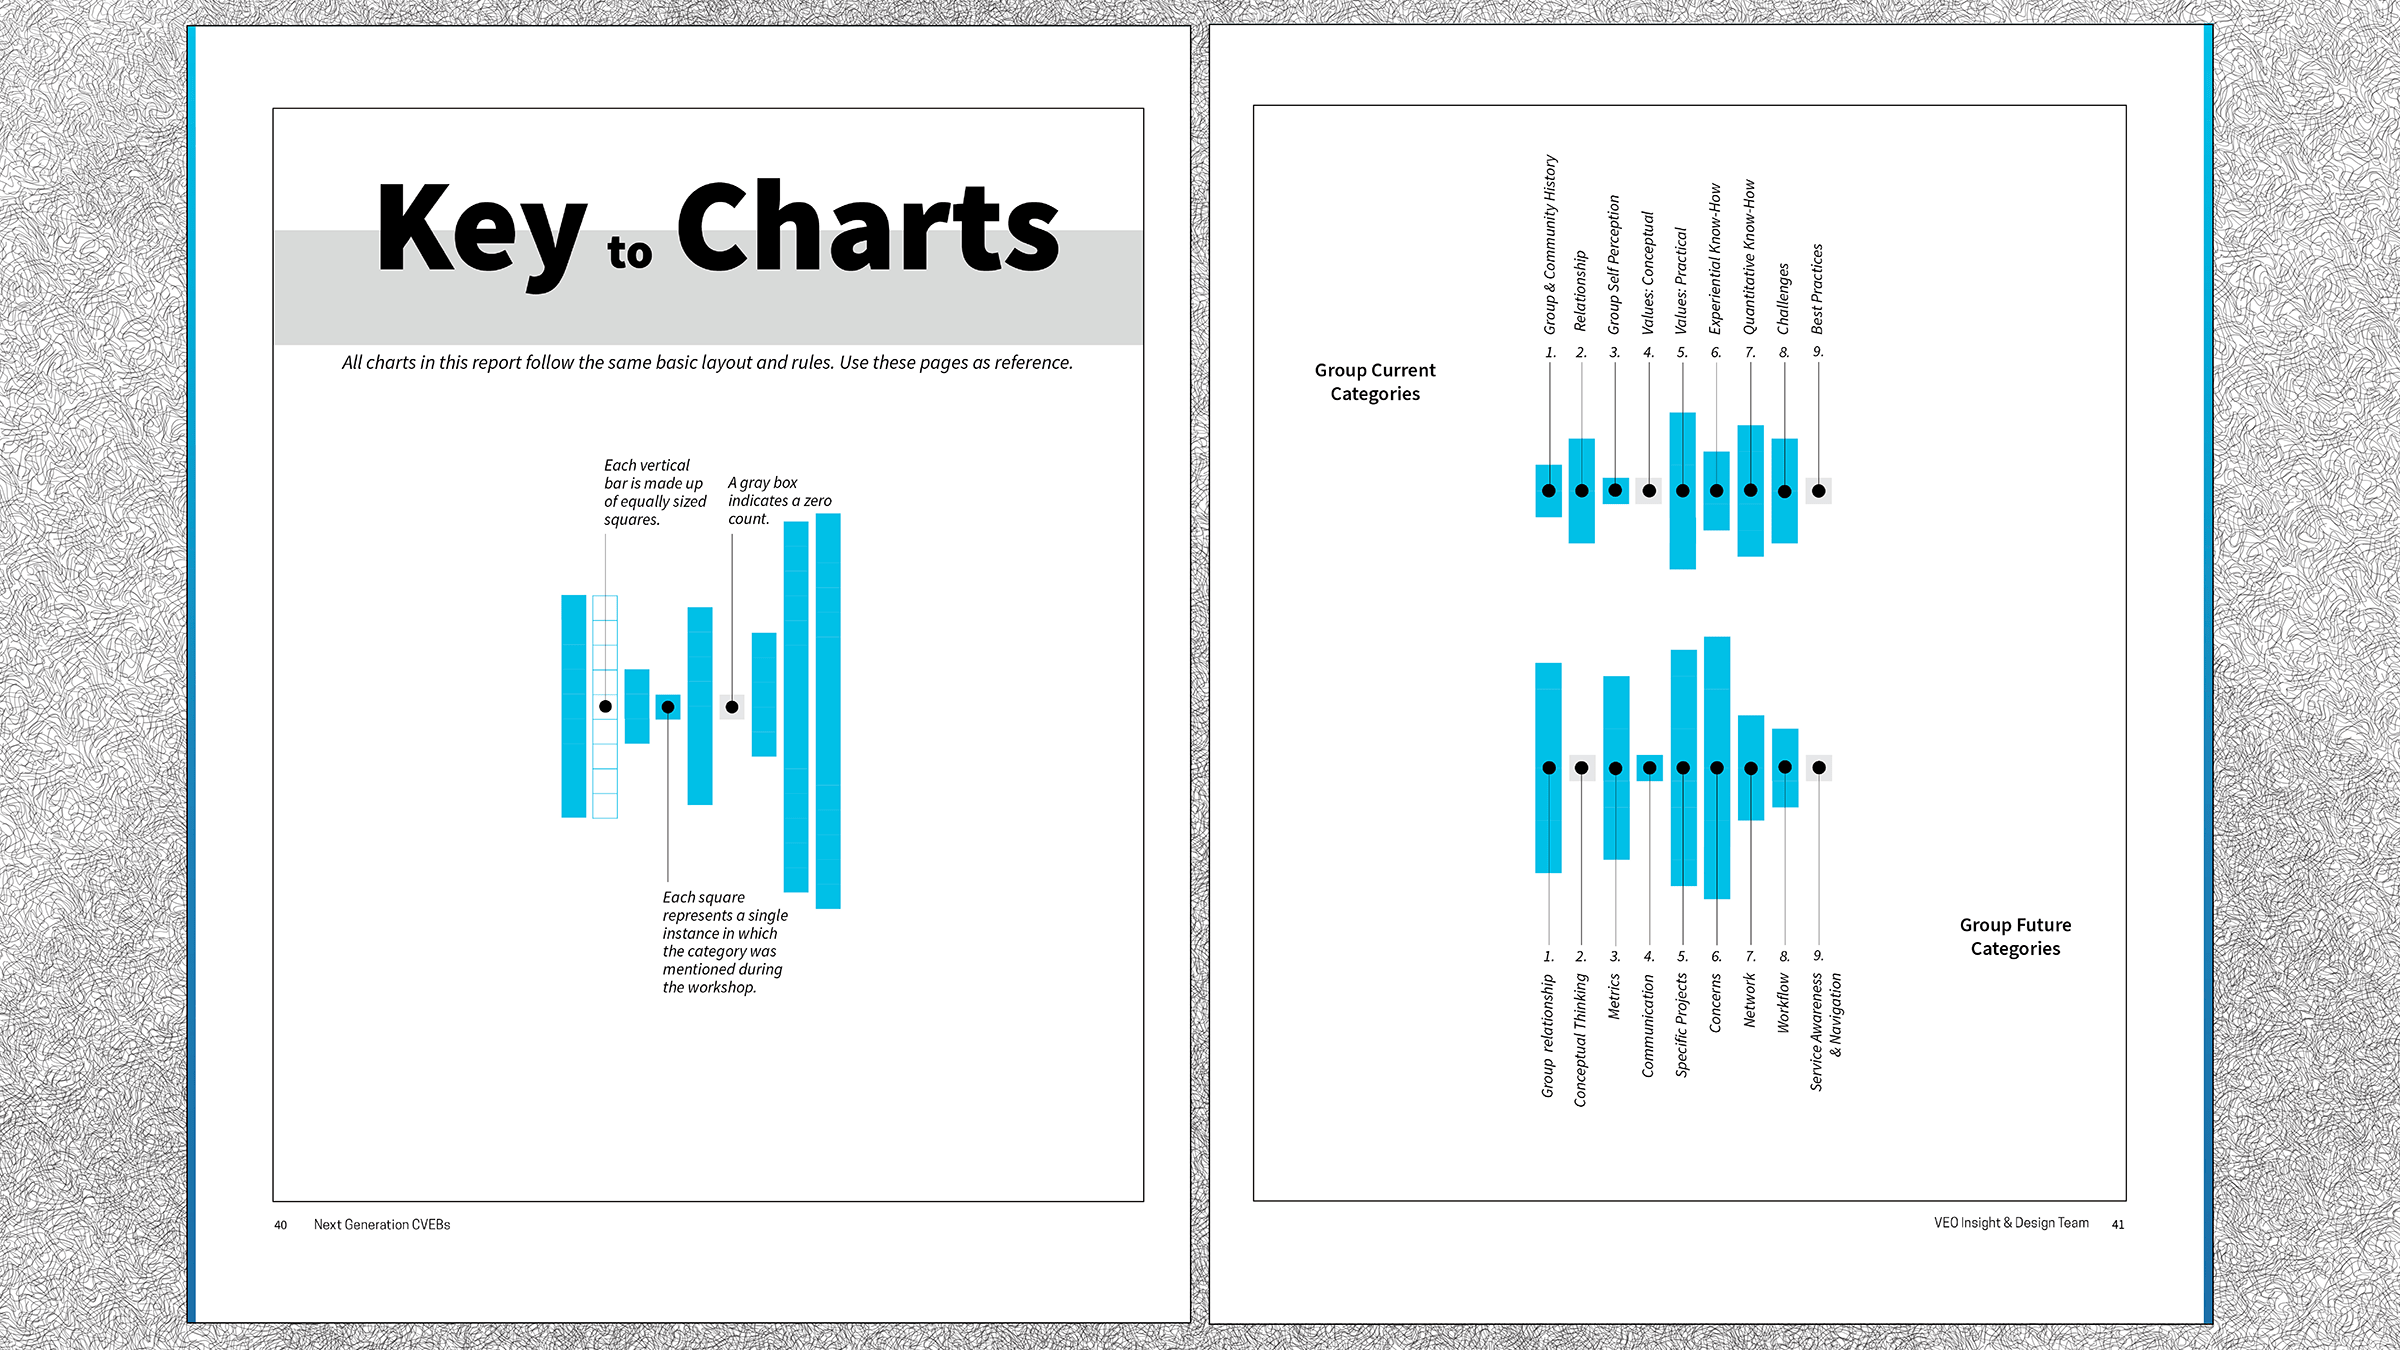
The data collected at each workshop was synthesized and interpreted individually through the categories listed above. The categories themselves surfaced from the workshops; they were not pre-determined by the research team, thusly reflecting the categories of value that were found to be common across the sample communities.
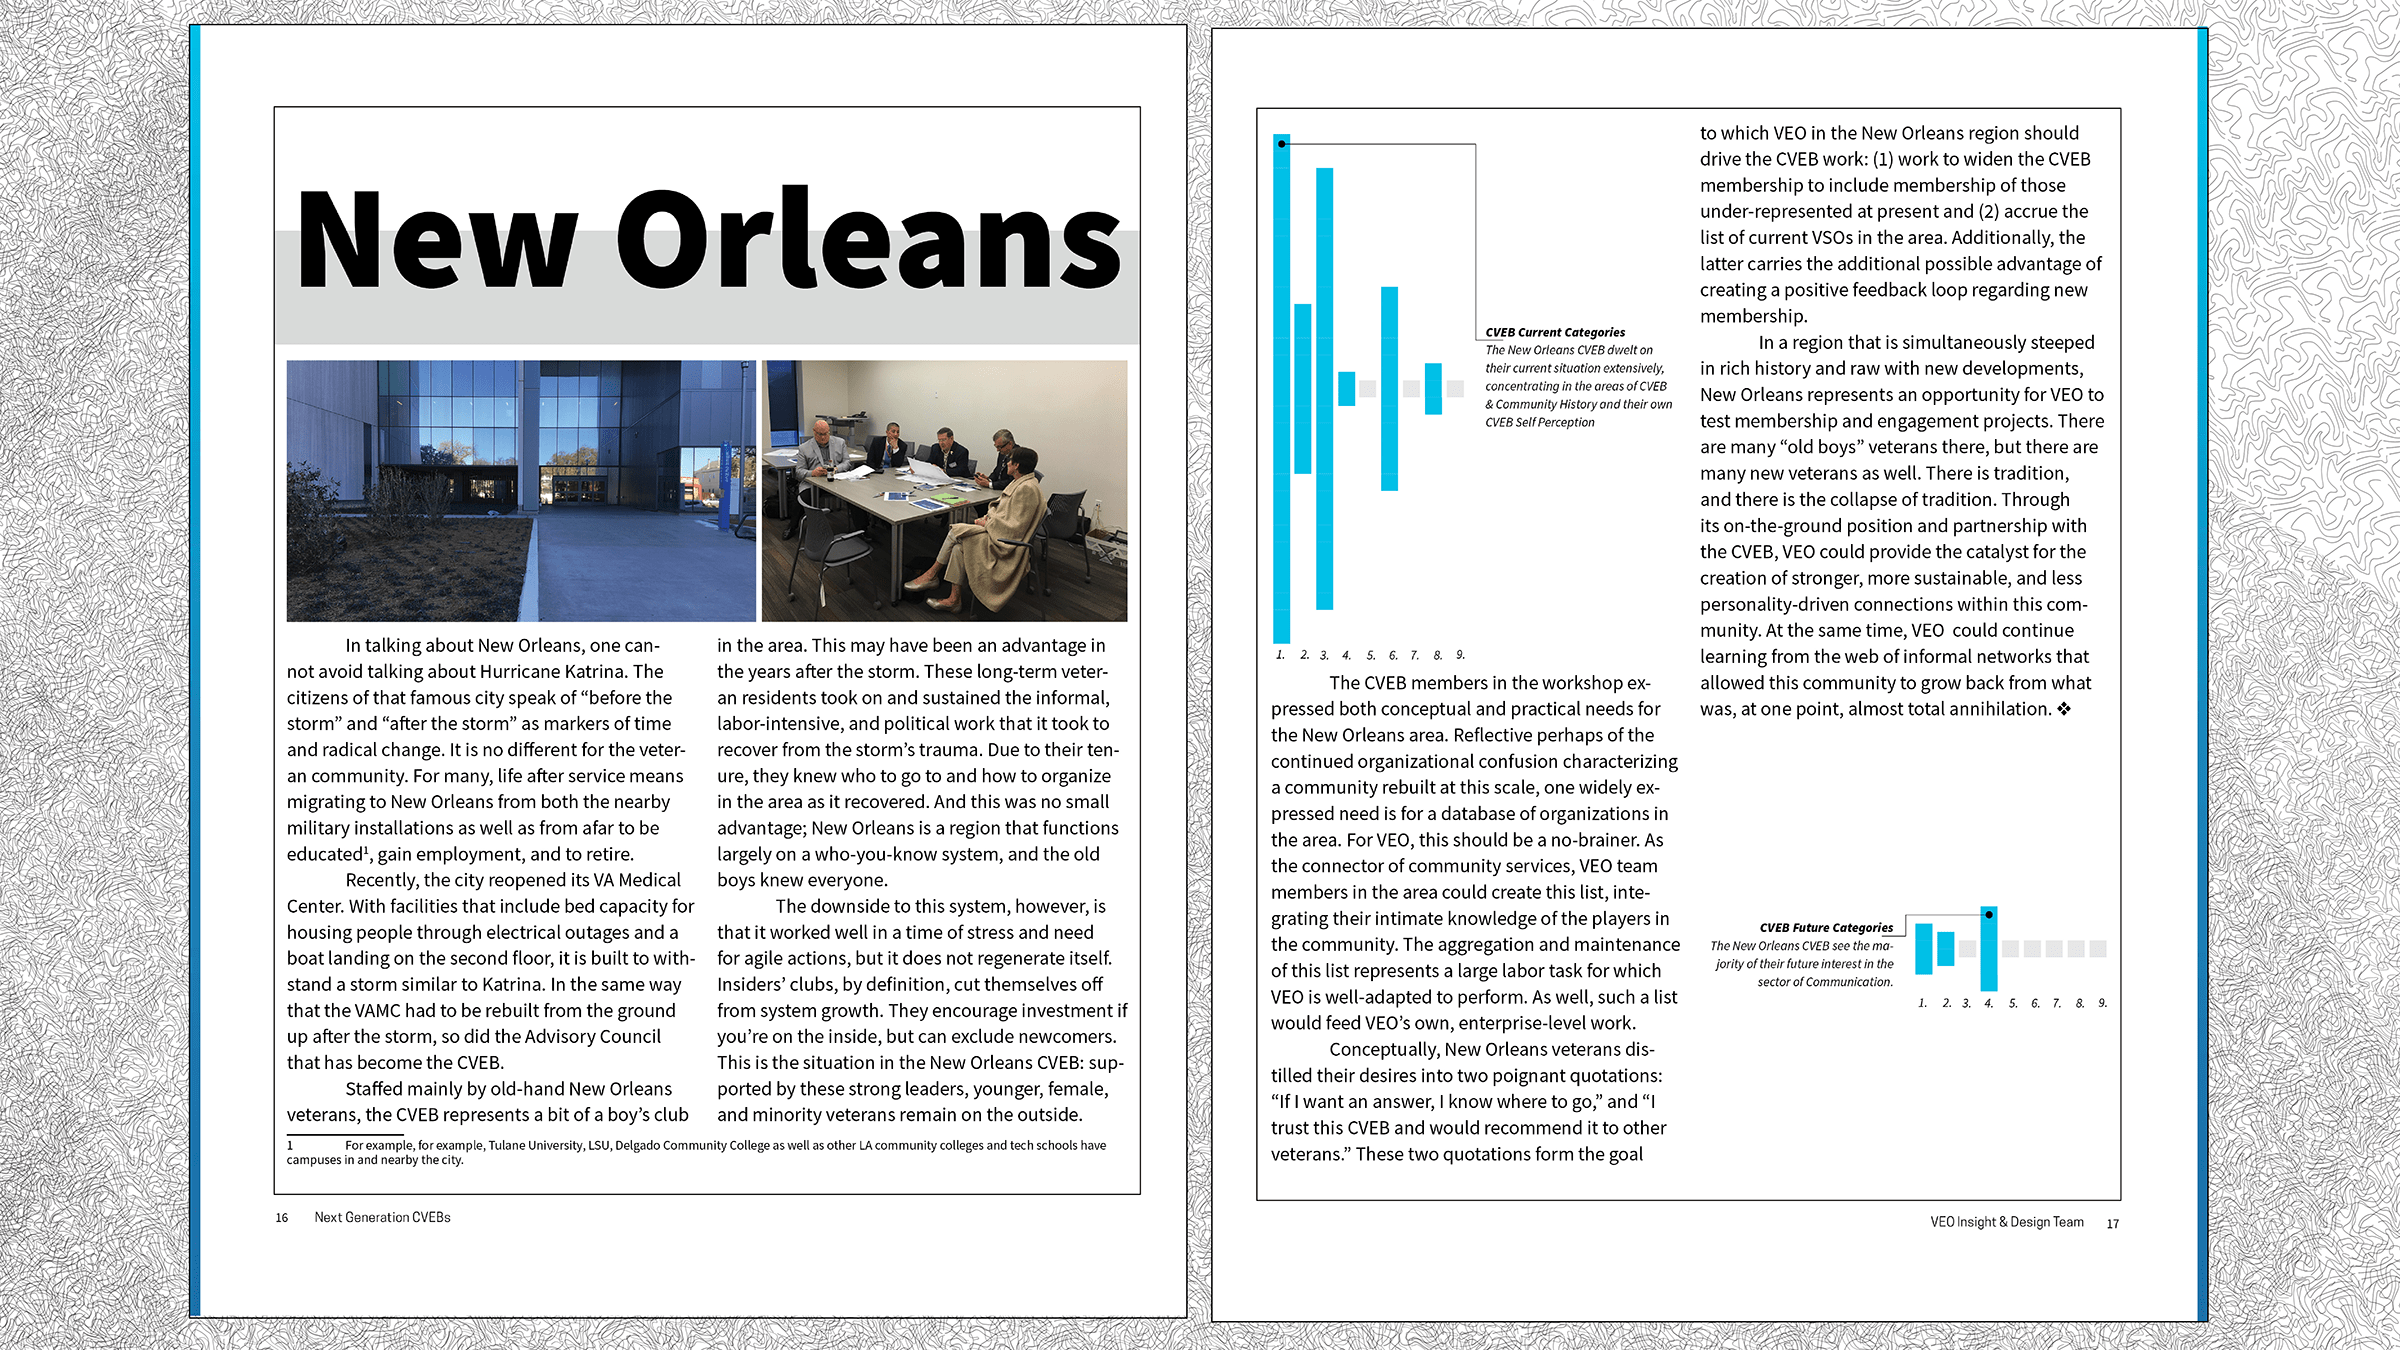
Essay and data visualization from the New Orleans CVEB.
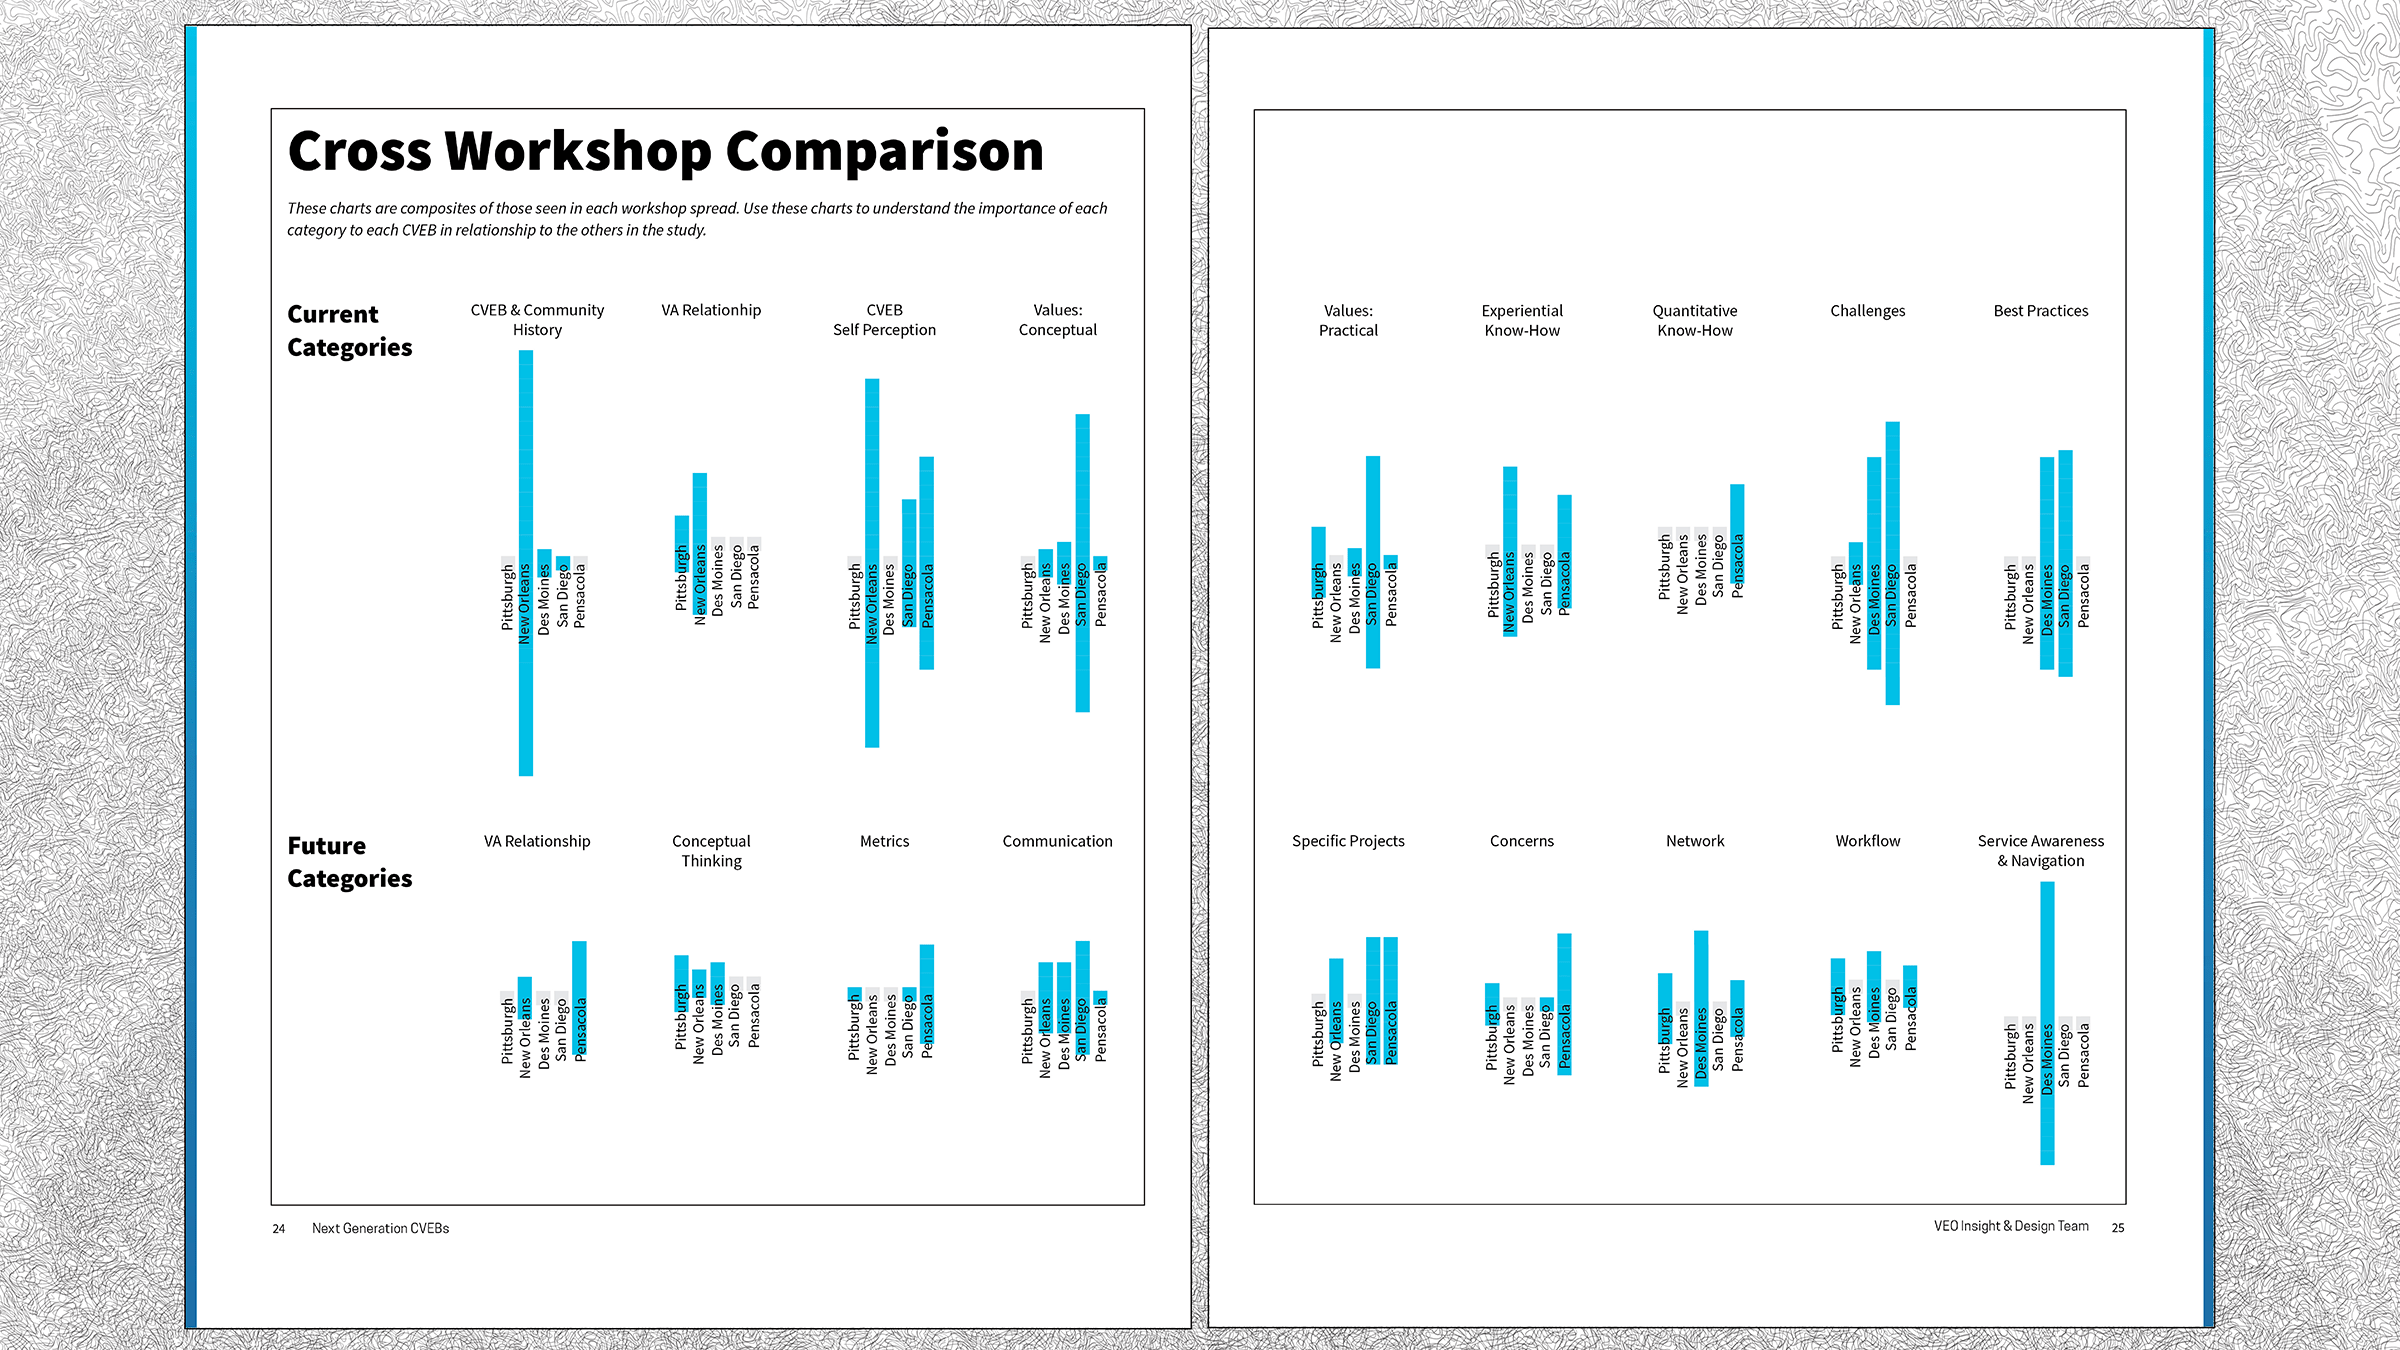
These charts are composites of the individual city profiles. By center aligning the bars, I was able to avoid one-to-one comparisons of each data point, instead showing areas of interest instead of straight forward more-or-less comparison.
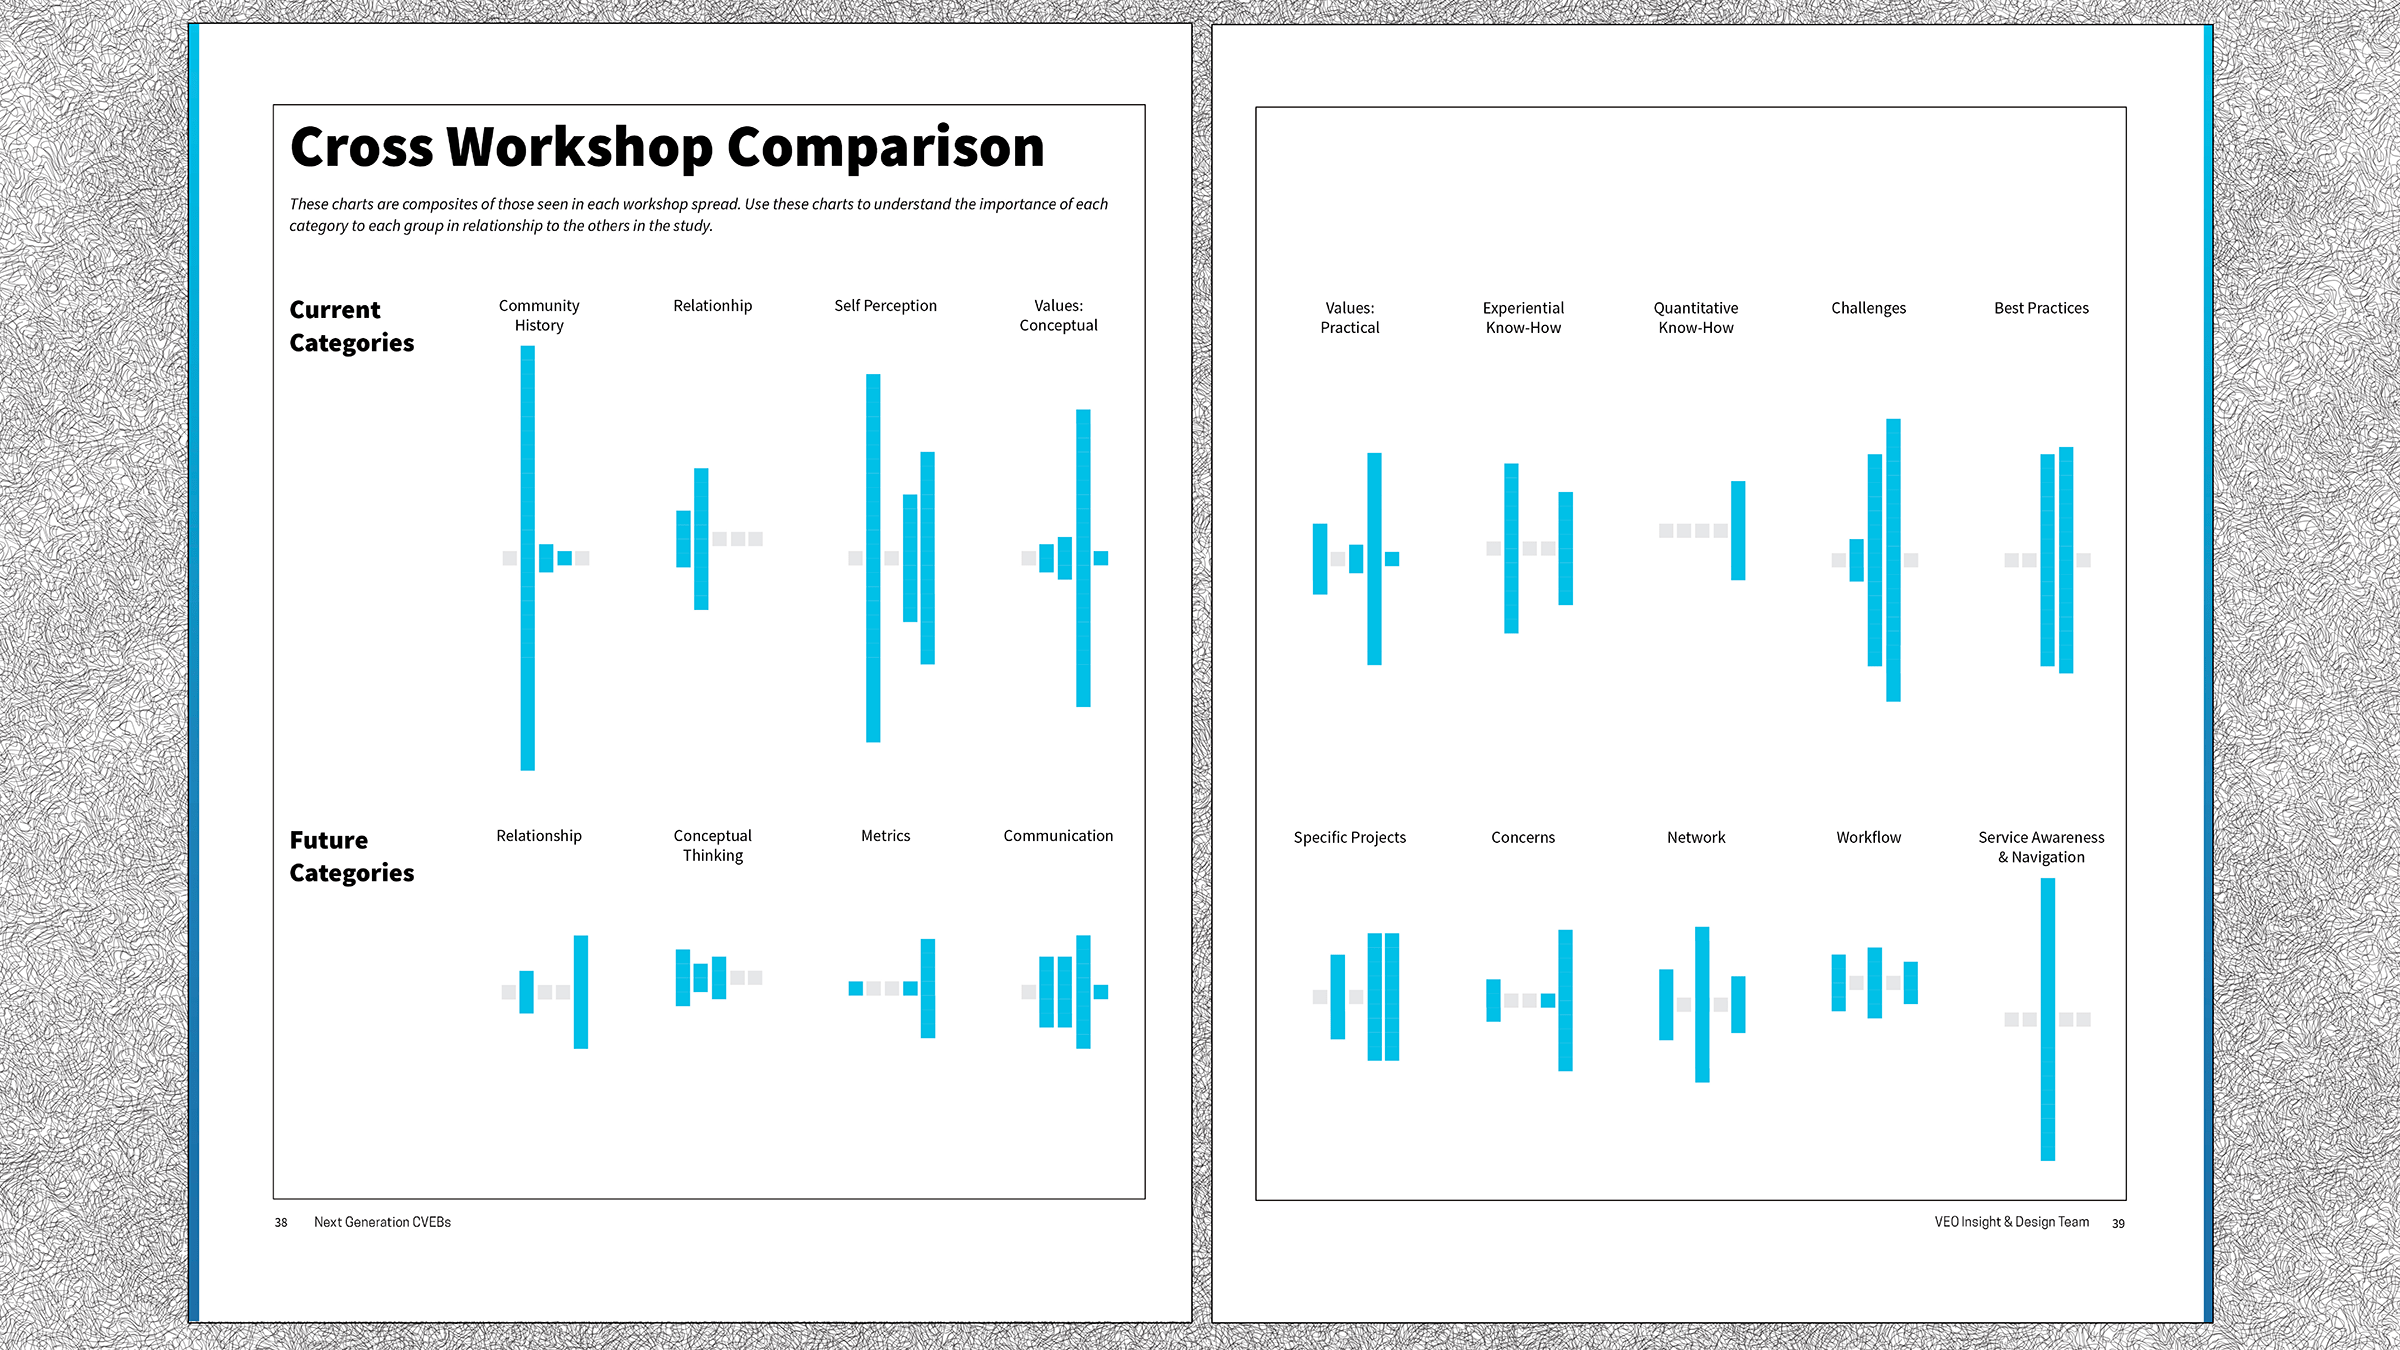
Learning from the painter's practice of turning a work around or obscuring it in some way to order to see new information,3 I also provided a chart stripped of the city labels and with generalized subject titles. Through this chart, VA is able to derive a general understanding of what is important to the five sample communities, aiding in decision-making around what type of pilot programs veterans might be most interested in.
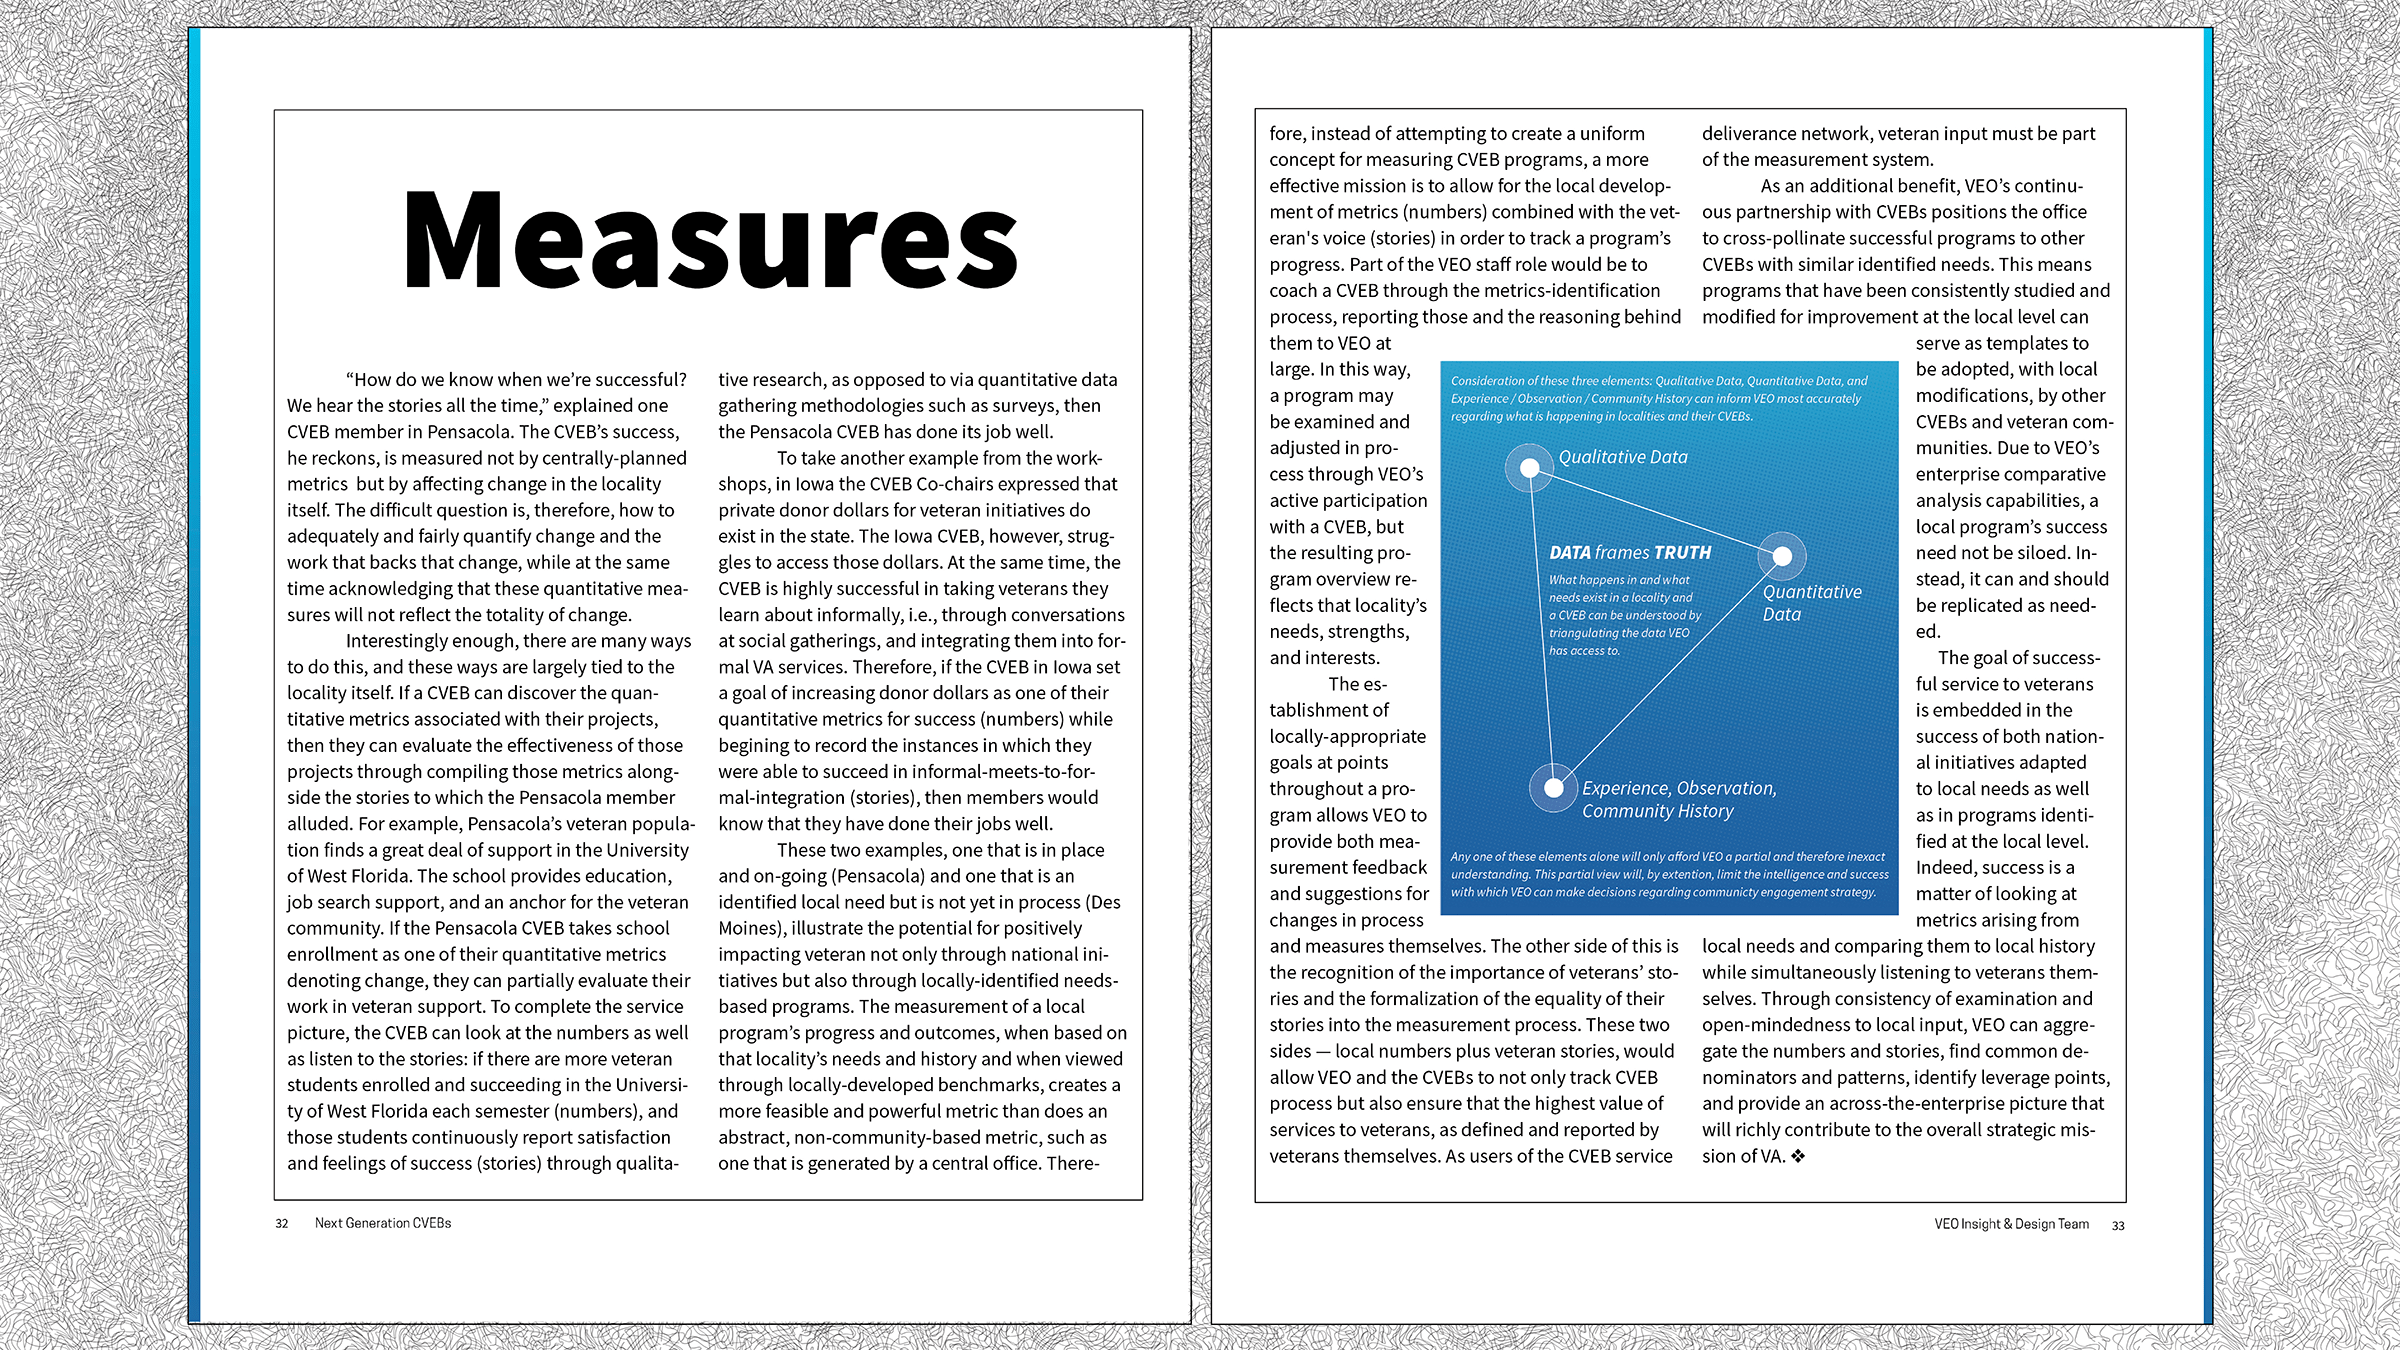
The project origin of the Data Triangle drawing and concept.
- Wow, that's quite an acronym, I know. The government has the best acronyms ever, though, if you find that sort of thing humorous. I do.
- For more on the concept of useful redundancies, please see the Designed Things article.
- Cross applying techniques from different disciplines is one of the hallmarks of modern design practice. To read more on this idea, please see the Design Thinking article.